Endangered Species
An interactive web app for children.
Web Design
Web Development
Illustration
ROLE
Designer
Developer
TIMELINE
2022–2023
TOOLS
HTML/CSS/JS
Clip Studio Paint
In Fall 2022, I designed and coded this interactive web application as part of my final project for MEJO 487: Advanced Interactive Media. I've recently redesigned it with a complete overhaul of the visual design.
THE ASSIGNMENT
Design and develop an interactive web app using a JSON dataset and the Google Maps API.
DISCOVERY
Finding a story to tell
When deciding on the topic of my web app, I considered three factors: how to 1) visualize location with 2) multiple data points using 3) a compelling narrative.
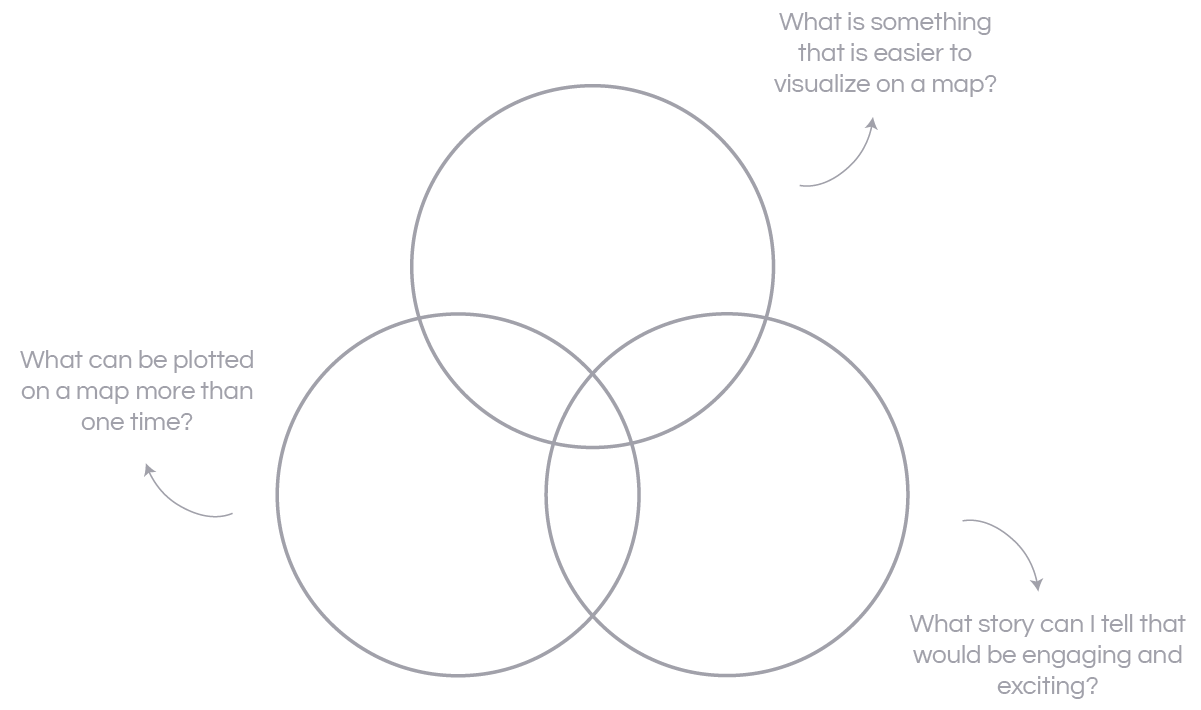
With all of these factors in mind, I decided upon endangered species as the subject of my web app.
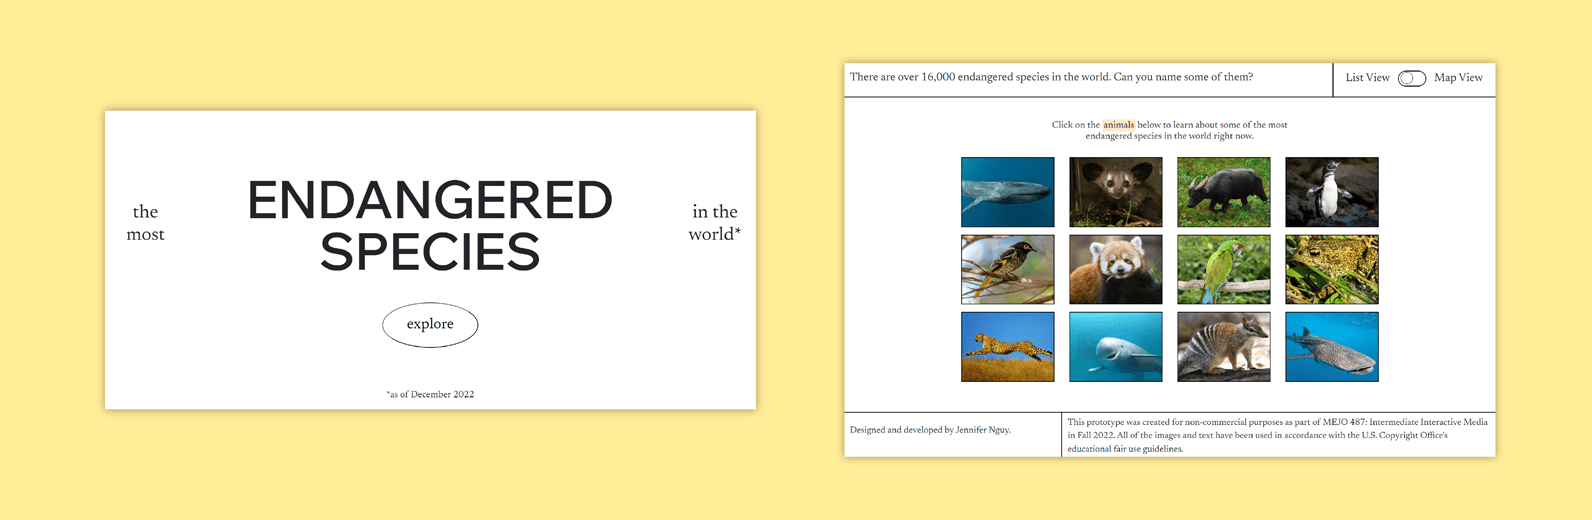
There are over 16,000 endangered species in the world, many of which are a part of our local ecosystems. Why not create something to raise awareness about them?
ITERATIONS
Evolution of the design
After finishing this project for class, I revisited it with some ideas for a redesign. The design choices of the past two iterations felt arbitrary, so I redesigned this project with a clearer target audience.
Given the nature of the dataset, I decided that my target audience should be young children who would navigate the web app with their parents. Similar to how zoos target their interactive features towards children and their families, the features and visual design of this web app should function similarly.
Click below to see each iteration.
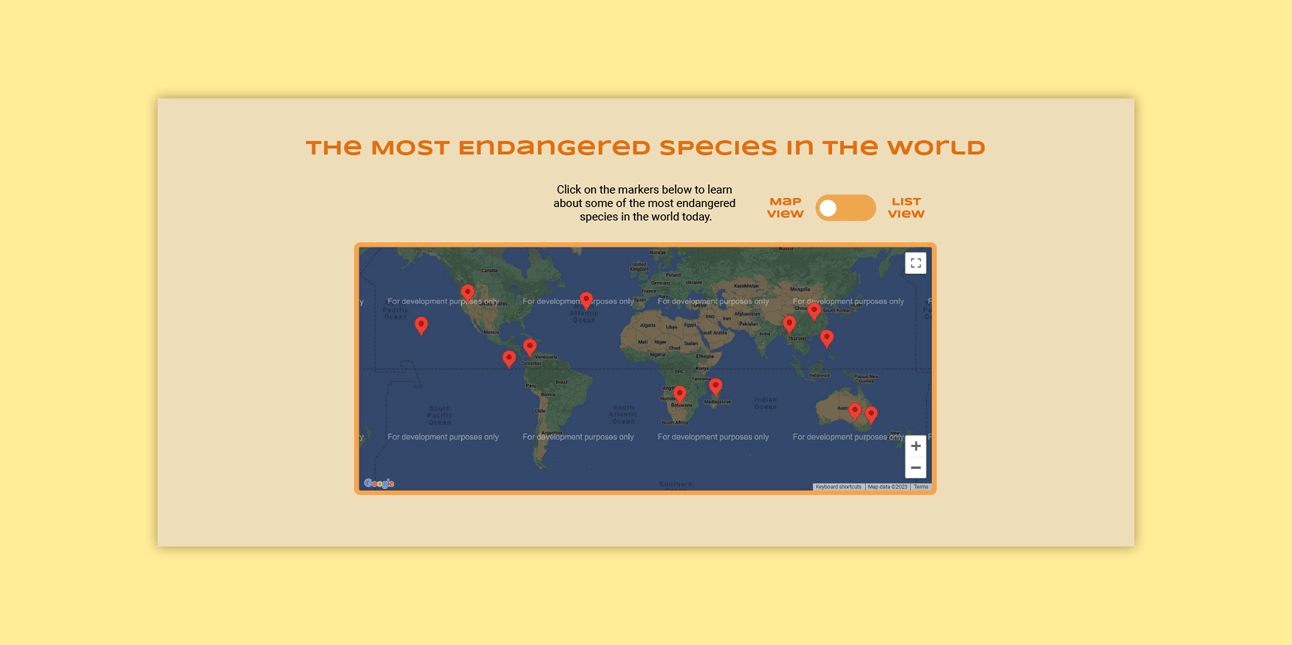
Fall 2022
THE PROCESS
Researching, designing, and developing
I divided the development of this web app into four different parts, in hopes of making the final coding process as smooth as possible.
01
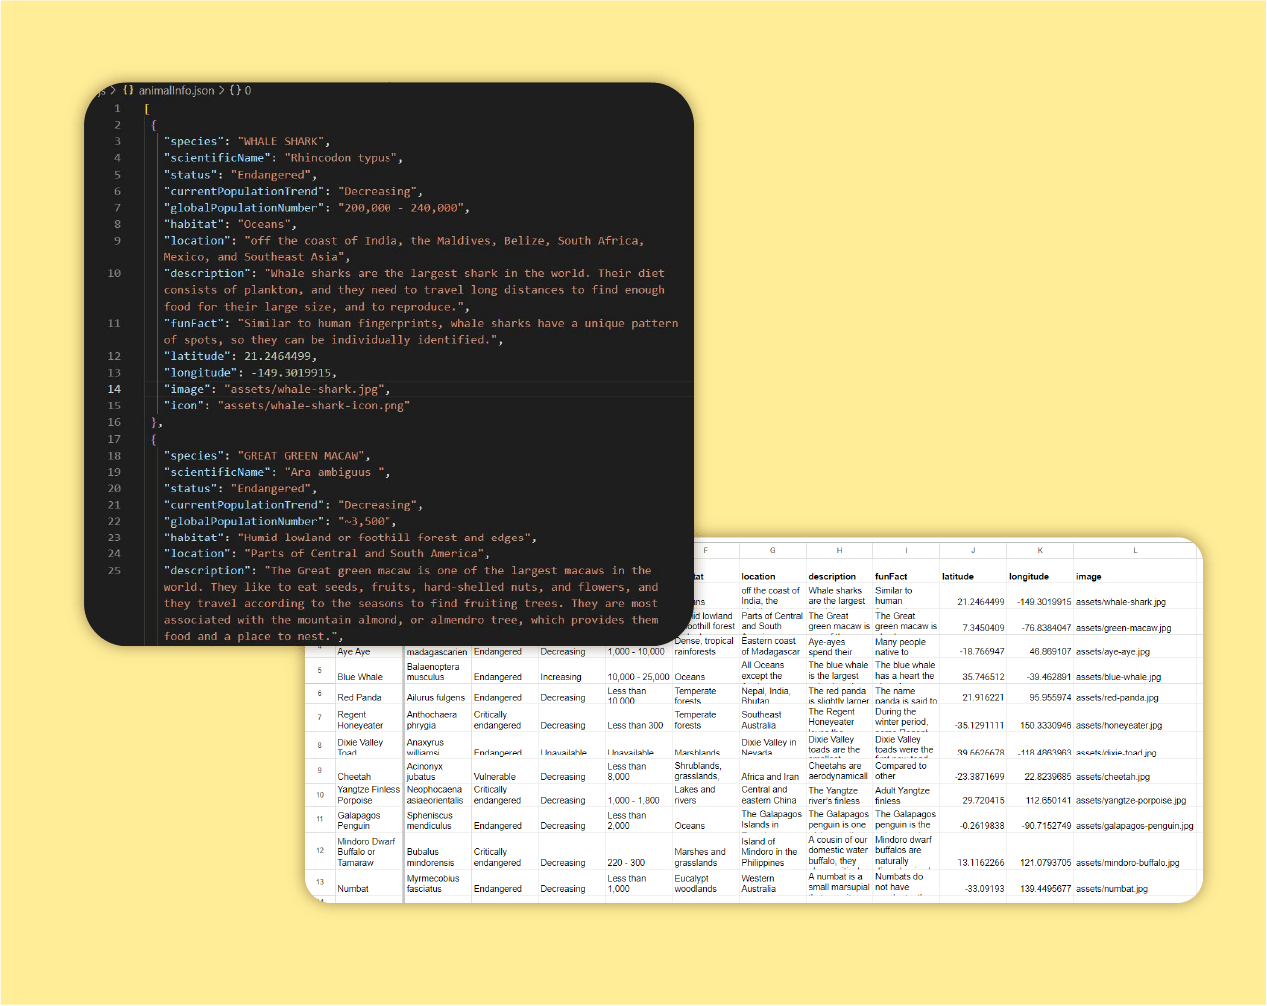
Research and create the dataset.
Since this web app is intended for children, I wanted to include a small number of endangered species to avoid overwhelming the user with information.
I created my own dataset using Excel and converted the spreadsheet into a JSON file.
02
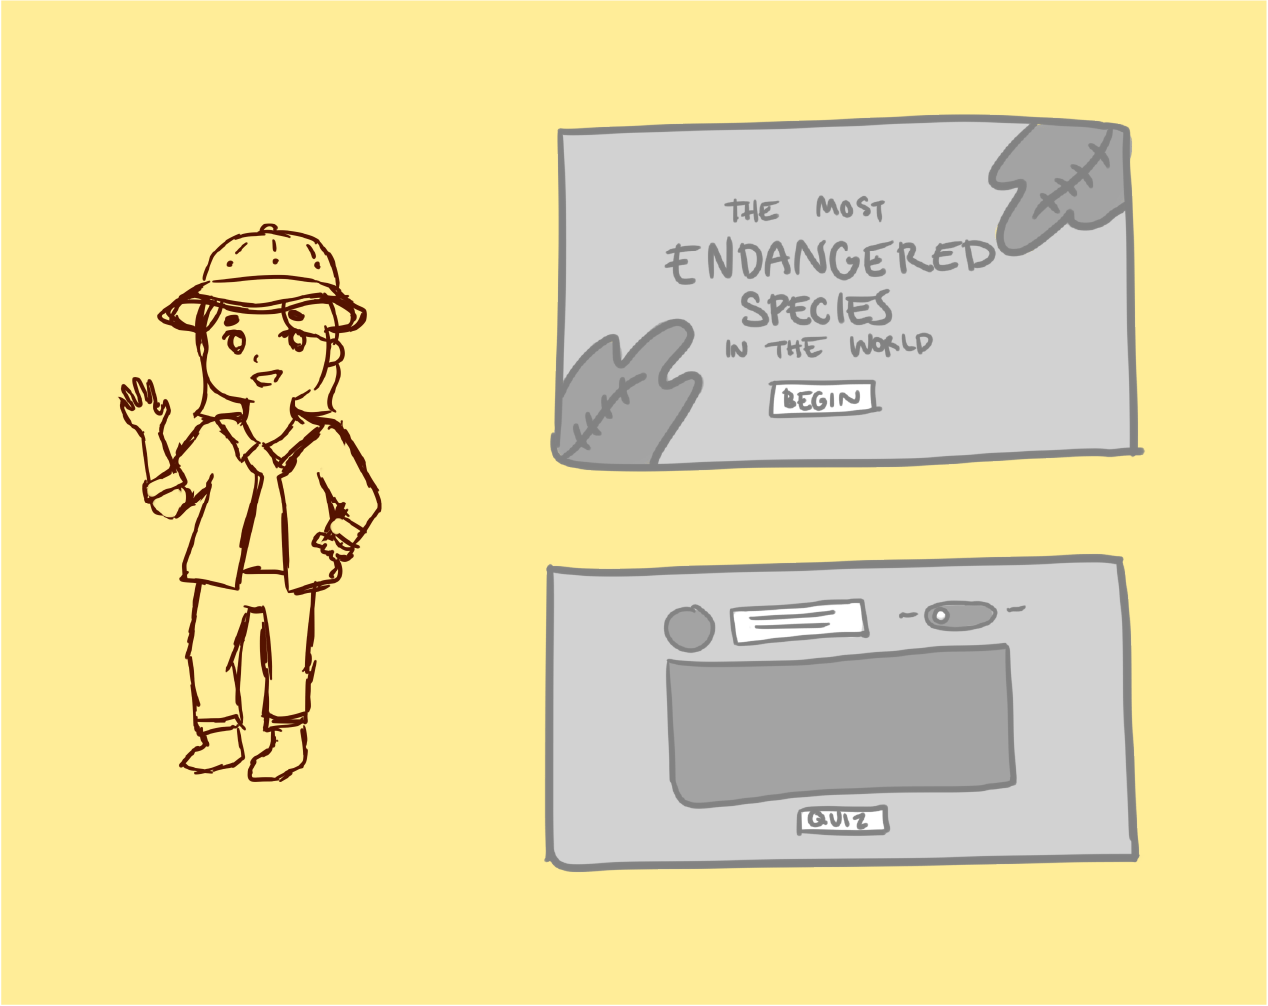
Sketch the design.
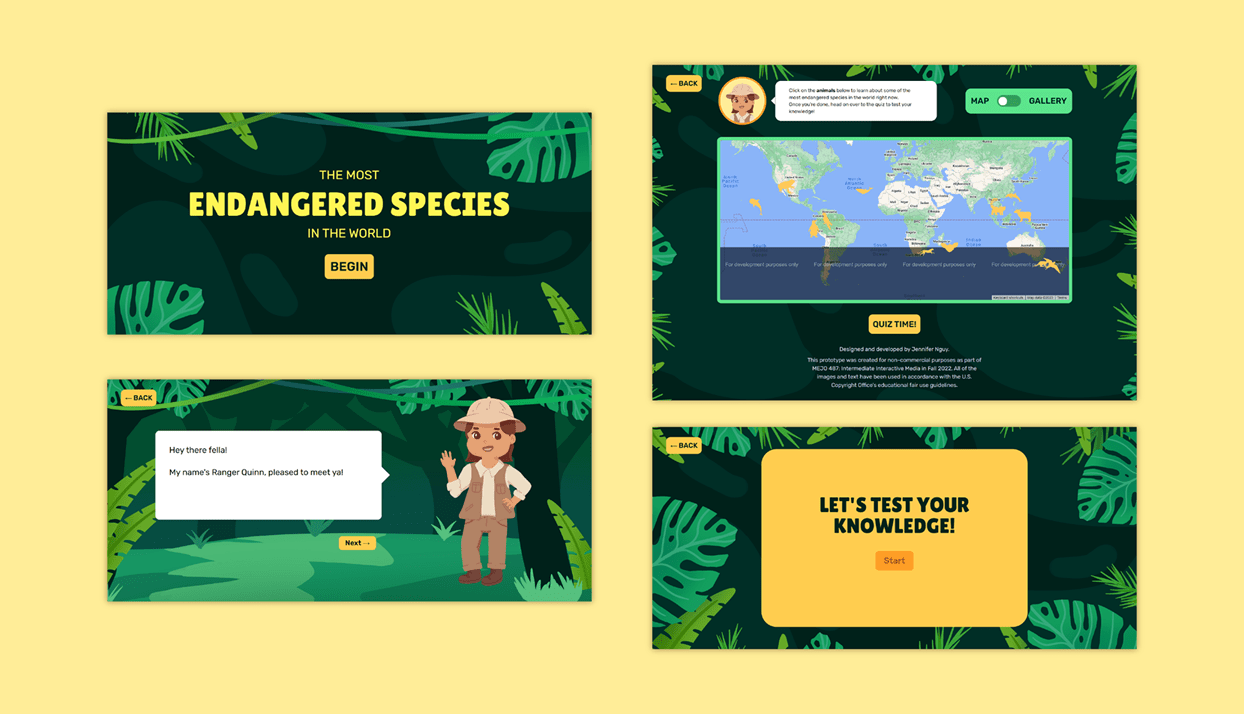
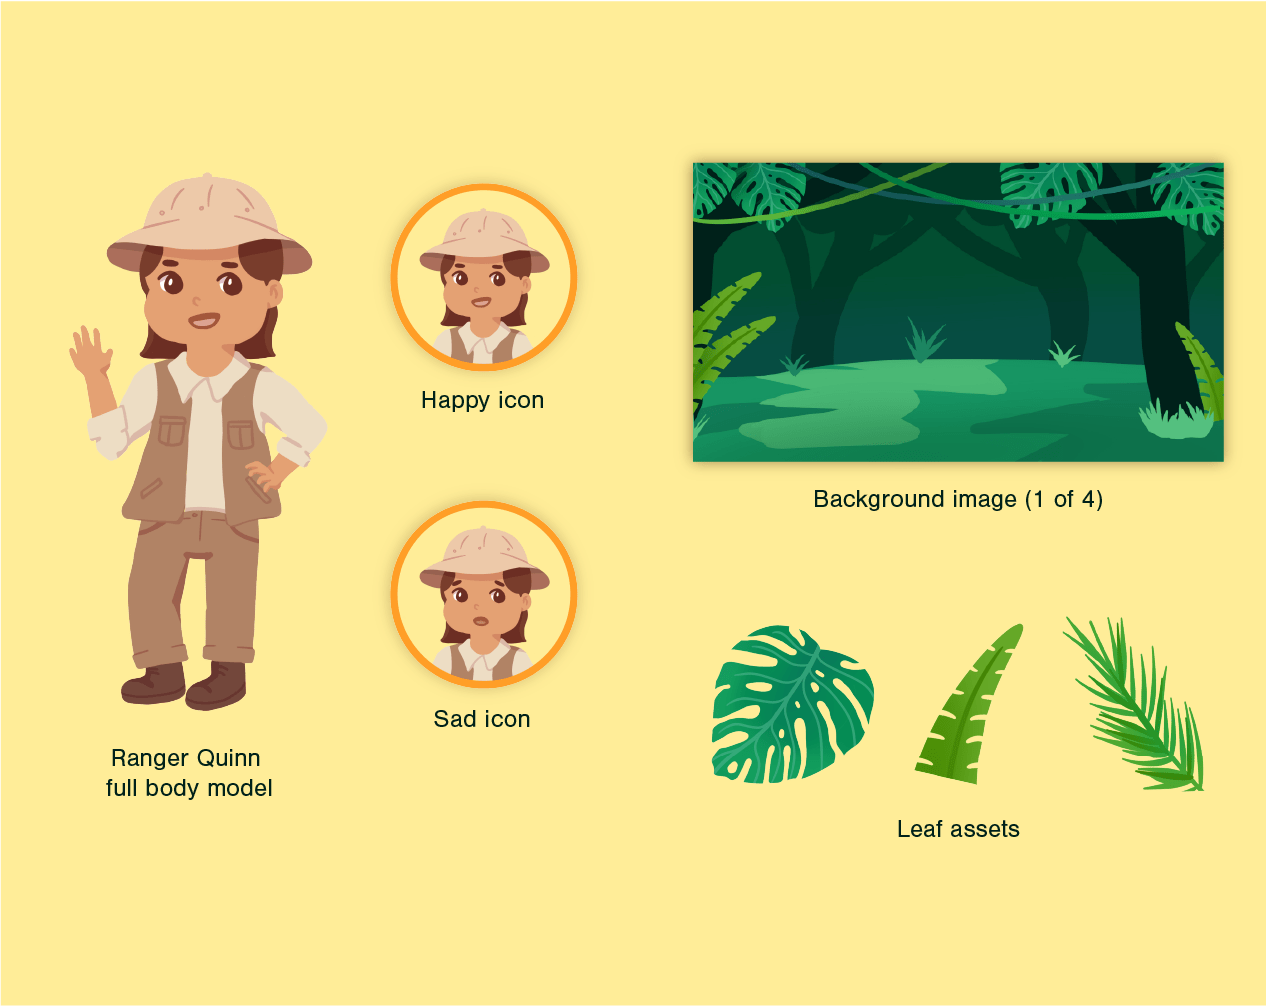
To make the web app more appealing to children, I chose a "safari" theme for the visual aesthetic and created a safari guide, named Ranger Quinn, to humanize the instructions.
03
Illustrate the visual assets.
To solidify the "safari" theme, I illustrated background images for each of the pages to enhance the immersion.
To bring more personality to Ranger Quinn, I gave her two expressions (happy and sad) to use as responses for the quiz section.
04
Code the web app.
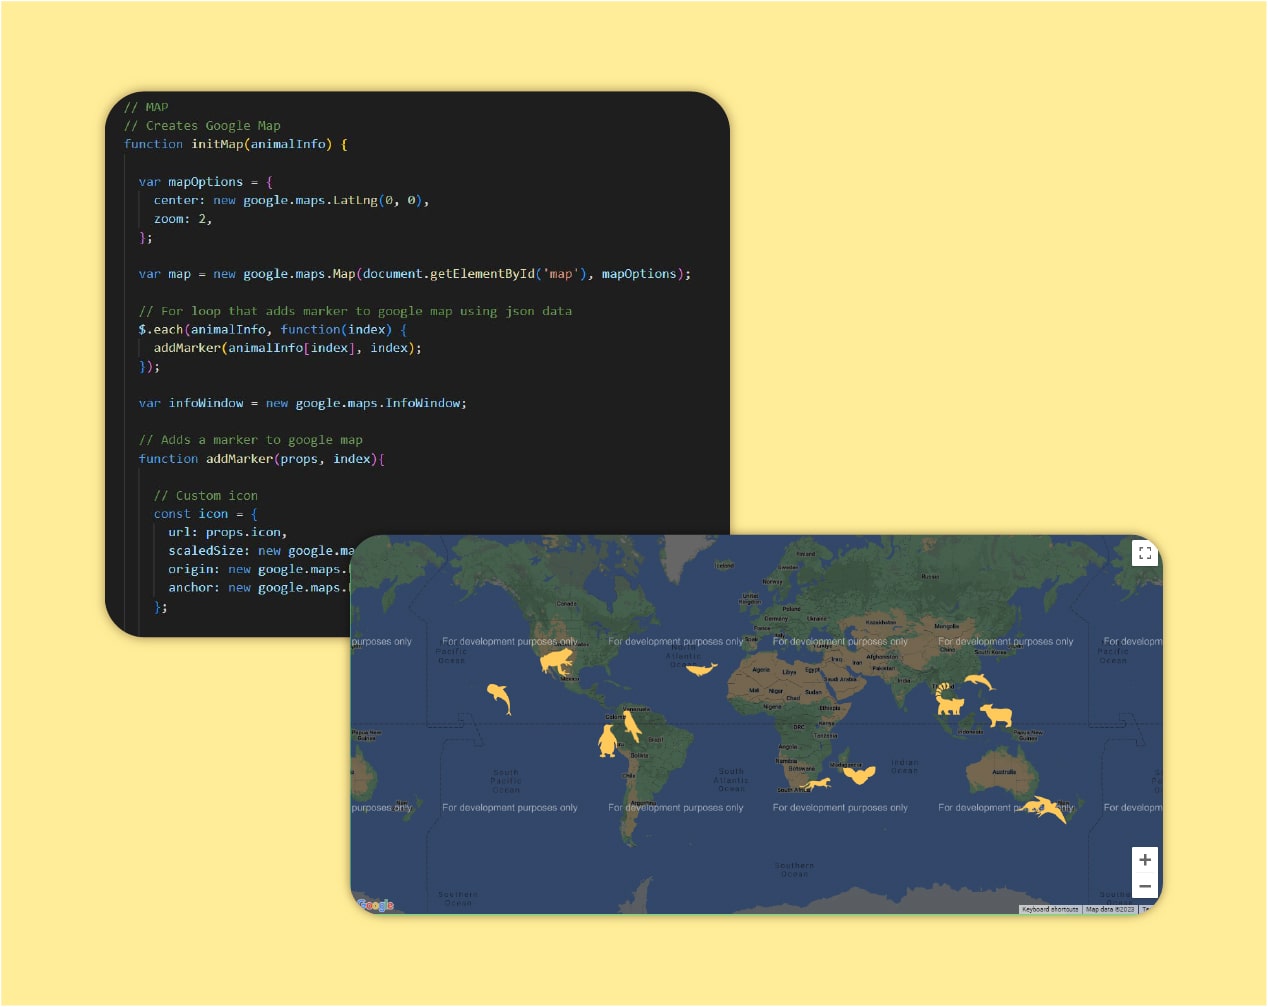
Upon coding the web app, I implemented the Google Maps API using the JSON dataset. I also customized the map by adding animal icons as markers.
I used several JavaScript plugins to create an interactive photo gallery and a quiz feature as well.
THE FINAL DESIGN
Key Features
Follow along with Ranger Quinn.
Creating a character to act as a guide for the user gives personality to otherwise anonymous instructions.
Ranger Quinn instructs the user on how to interact with the map/gallery and also gives feedback on quiz questions.
Visualize the data in two different ways.
Users can learn about the endangered species either by clicking on their icons on the map or clicking on their pictures in the gallery.
On mobile screens, the gallery turns into a swipeable slideshow for easier navigation.
Test your knowledge.
Users can better retain the information they learned with a quiz feature.
Ranger Quinn gives feedback on quiz questions, and her expression changes depending on if the user answered correctly or incorrectly.
Learnings
There's always room for improvement.
Revisiting this project a year later allowed me to reflect on what the purpose of this app should be. I was able to design with a stronger focus this time, crafting a story and visual design that was more appropriate for the dataset.
Take advantage of your skills where you can.
Using my digital illustration skills, I was able to enhance the storytelling of this web app by illustrating assets that were more appealing to children. It helped me understand the strengths of being a multidisciplinary designer and how I can best apply my skills.